
The Diagnostic screen displays debugging information from the system such as core dumps, log files, and so on, to diagnose any system issue. Use the screen to review and/or download the data.
The Diagnostic screen has two tabs: Logs and TC Dump.
Logs
The debug log records database operations, system processes, and errors that occur during operation. It is a valuable tool for any system administrator.
- Click on the Live Monitor tab > Diagnostics on the ScaleArc dashboard.
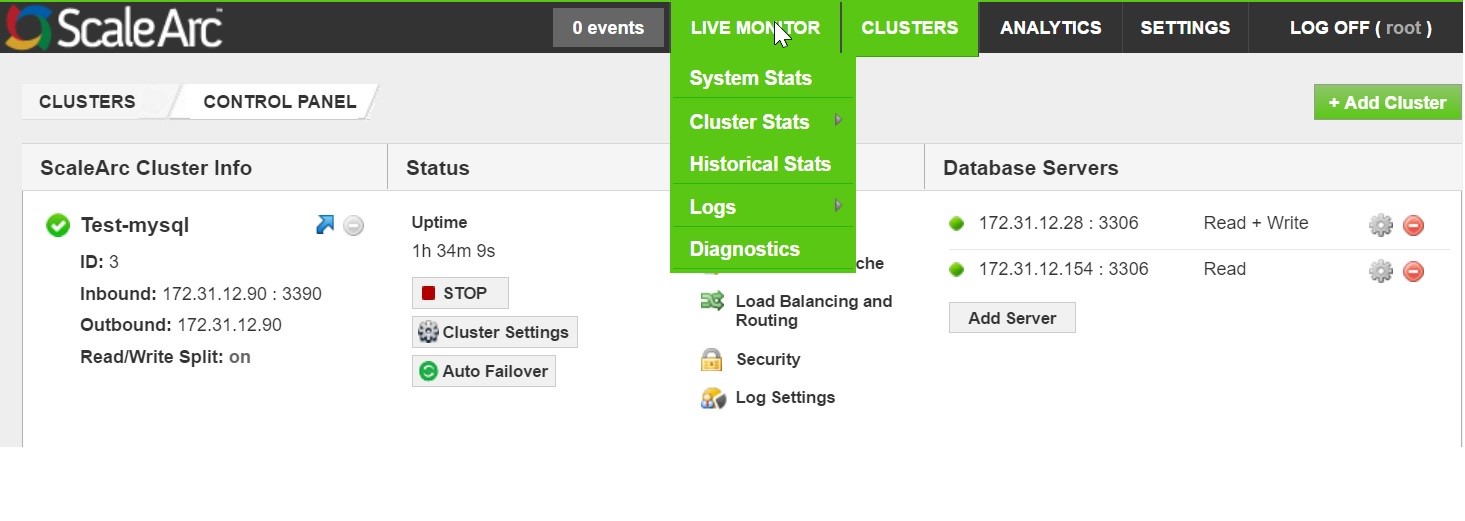
- Click on the Logs tab.

Download debug files
Whenever ScaleArc crashes, it collects the required files and creates a tar file that can you can use for analysis. Access this file in Debug logs. In the event of a crash:
- Click Upload to upload the file on to the sftp server.
- Click Delete to remove the file from ScaleArc.
- Click Download to load the file to your local machine. This file provides the details on the crash.
Upload a day's logs
- Select a date from the drop down menu.
- Click Upload to upload the logs to the sftp server.
Download a day's log
- Select a day from the drop down menu.
- Click Download to download the logs to your local machine.
File browser
This option let's you review the upload and download files in the logs directory.
- mnp-stub
TC Dump
The TCP Dump screen allows you to save the packets that are captured to use for analysis.
- Click on the Live Monitor tab > Diagnostics on the ScaleArc dashboard.
- Click on the TC Dump tab.
-
Select the mode for capturing TCP dump from one of these three modes:
A cluster-based TCP dump that captures data for a particular cluster. If you select this mode, select the cluster from the list of clusters in the drop down.
The Host and Port option that captures data for a particular IP address/hostname and port. If you select this option, enter the hostname and port.
The Custom mode option that allows you to customize a PCAP string. If you select this option, enter the PCAP filter.
- Enter the Base Filename.
Capture the file options:
Field Description Default/User input Number of Files The number of files that TCP dump creates Enter a number. Size of Files (in MB) The maximum size of each file Enter a number. Capture the scheduling options:
Field Description Default/User input Start Delay (Sec) The duration you would like TCP dump to wait before capturing data.
Enter a number (seconds). Capture Duration (Sec) The duration that TCP Dump continues to capture data before it stops.
Enter a number (seconds). Rolling Capture When enabled, TCP dump continues capturing data for the specified number of files with maximum size defined in the capture file options. If disabled, TCP dump quits when this condition is met.
Select Enabled or Disabled from a drop down. Identify the advanced option.
Field Description Default/User input Size of Packets (in bytes) Elects the amount of data that is captured in each TCP packet. Enter the dump script options and click on Start to begin capturing TCP dump files.
Enter a number (seconds).
Comments