
The Historical Stats screen gives you a look into the historical properties of the system or the cluster. This is very useful for analyzing and troubleshooting system behavior.
For a system or an individual cluster, choose a category to load the data associated with your selection. The resulting graphical display includes one or more data types. You can toggle on/off the legend corresponding to a specific data type to isolate and review behavior.
Load historical data
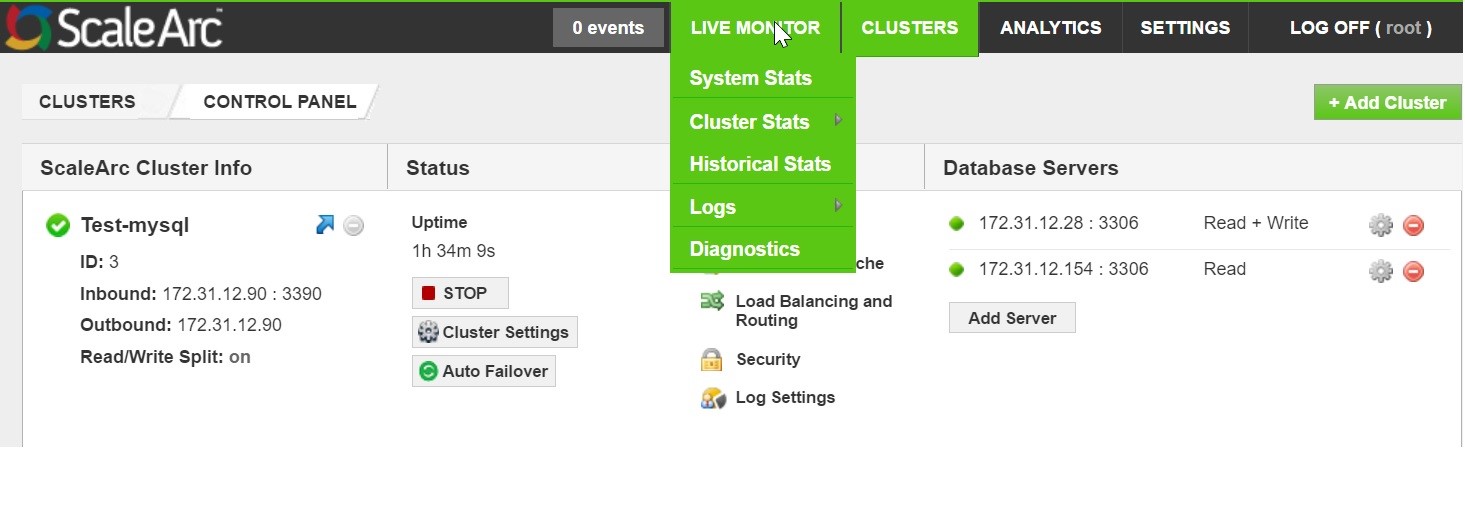
- Click on the Live Monitor tab > Historical Stats on the ScaleArc dashboard.
- Select a type, category, date range, and resolution from the drop down. Click Load Data.

Toggle a legend below the graph to show or remove a data type on the graph.
Graph Description Legend User input Cluster Type Can list systems or individual clusters.
Displays historical information for Client/Server Connections, Cache Usage, Query/Second, Cache Hit Rate, Queries Count per Server, and Cache Usage per DB.
Select System or an individual cluster from the drop down. Category Select a category. If you have selected a cluster, see Cluster stats for a description of each category. CPU Usage Graph Shows the real time CPU usage of the selected system or clusters on ScaleArc.
Load balancer
Cache
Queries
ConnectionsToggle the legend to show or hide a data type from the graph. Bandwidth Usage Graph Shows the network bandwidth usage (in MB/s or GB/s) for the system or cluster traffic on the ScaleArc appliance.
Inbound Outbound Toggle the legend to show or hide a data type from the graph. Cache Usage Graph Shows the cache used by the system or cluster on the ScaleArc appliance.
Cache size Toggle the legend to show or hide a selected data type from the graph. Client/Server Connection Graph Shows the number of network connections of different types on the system or cluster.
Client Server Read Q Write Q Persistent client Error Thick Toggle the legend to show or hide a selected data type from the graph. Query/Second Graph Shows the real time throughput of queries in the clusters or system.
Read Write Block Error Thick Toggle the legend to show or hide a selected data type from the graph. Mpstats Shows the processors related statistics. See mpstat for more details.
User System IO Wait Idle Toggle the legend to show or hide a selected data type from the graph. VmStats Shows the virtual memory statistics of the system. See vmstat for more details. Free Buffer
CacheToggle the legend to show or hide a selected data type from the graph. Units In Mb or Gb, depending on the data rate. Select a unit, if applicable. Start date The start date for the graph. Select a date. End date The end date for the graph. Select a date. Resolution Shows the graph over the selected time. Choose a resolution time from the drop down menu. ID The itemized list. Date The date on which an activity occurred for the selected system or cluster. Message Describes the user activity related to a selected system or cluster.
Comments