
System stats
The System Stats screen includes information about the ScaleArc system itself. Graphical representations show CPU Usage, Bandwidth Usage, Cache Usage, Client/Server Connections, and Queries, per query type.
Use system stats
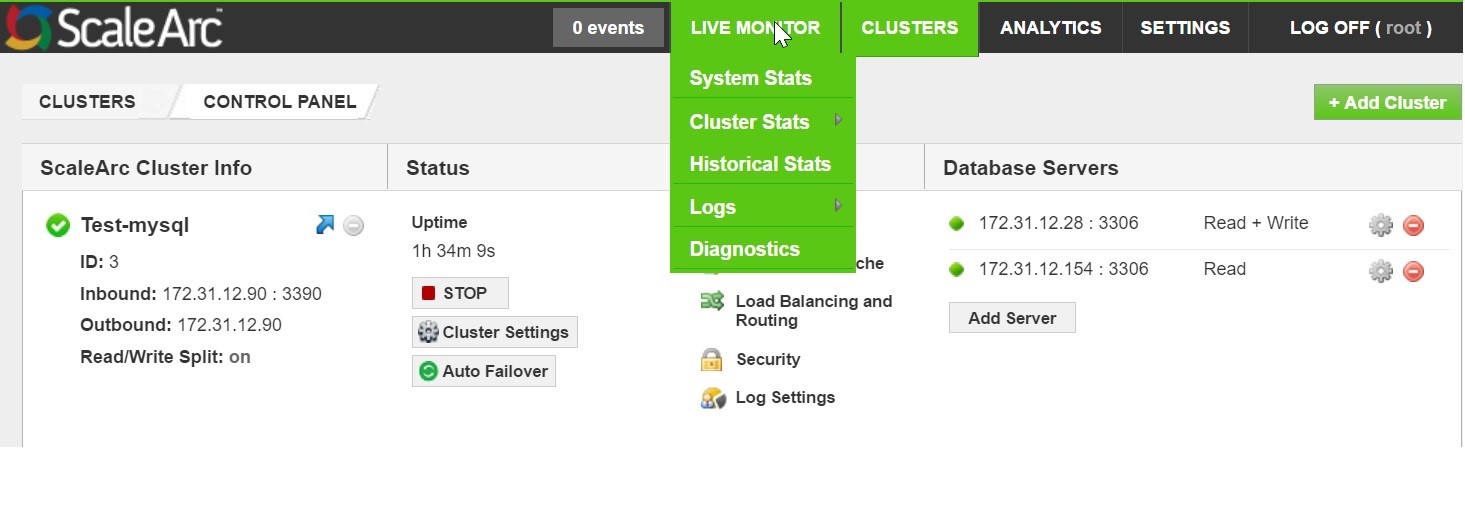
- Click the Live Monitor tab > System Stats on the ScaleArc dashboard.
Review the screen for system health.

Graph Description Default/User input 1 CPU Usage Shows the PERCENTAGE? of real time CPU usage of the different ScaleArc processes on the ScaleArc appliance.
Click on one or more of the toggle buttons below the live chart to see the percentage of usage for the selected component(s). 2 Bandwidth Usage Shows the real time network bandwidth usage, in MBs or GBs, for both inbound and outbound traffic on the ScaleArc appliance.
1 Click on GB or MB in the top-right corner to choose the bandwidth type. 2 Click on the inbound and/or outbound toggle buttons below the live screen to see the selected traffic. 3 Cache Usage Shows the real time memory cache usage in MBs or GBs on the ScaleArc appliance.
1 Click on GB or MB in the top-right corner to choose the bandwidth type. 2 Click on the Cache Size and/or Invalidation Cache Size toggle buttons below the live screen to see the cache usage for the selected items. 4 Client/Server Connections Shows the number of network connections of different types on the ScaleArc appliance.
1 Click on Thousands or Units in the top-right corner. 2 Click on one or more of the toggle buttons below the live screen to see the network connections for the selected items. 5 Queries Shows the real time throughput of queries on the ScaleArc appliance, based on the different query types.
1 Click on Thousands or Units in the top-right corner. 2 Click on one or more of the toggle buttons below the live screen to see the throughput of queries for the selected items.
On this page
Comments