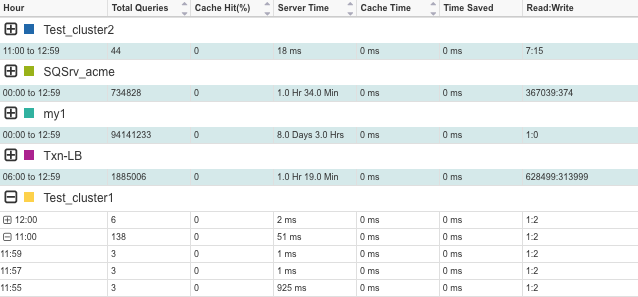
Cluster analysis gives us a breakdown of the query traffic associated with the selected cluster by the hour and minute, within the timeframe selected. You can download a report at any time from the page using the Download Report button for this time period.
Charts
ScaleArc represents the query traffic breakdown with the help of two chart types:
| Chart type | Description |
|---|---|
| Total queries pie chart |
Provides the percentage of total query use for each database within the cluster.?? |
| Server time pie chart. |
Provides the percentage of total server time each of the databases requires for its respective queries. Each database shows a breakdown of Total Queries, Cache Hit, Server Time, Cache Time, Time Saved, and Read:Write ratio. Highlighting a database exposes additional details for query breakdown by server within the ScaleArc cluster and types of queries |
Break down cluster traffic
Follow these procedures to reveal the traffic details, which include the total number of cache , server time, time saved, and Read-Write calls for the cluster in a selected time period (a day).
- Click on the Analytics tab on the ScaleArc dashboard.
- Select the time period.
Scroll down to the grid on the lower half of the screen.

- Click on the + (plus) sign next to the cluster to see the hourly breakdown of traffic for a twenty-four period (if you selected a day for your time period).
- Select one of the hours and click on the + (plus) sign next to it to see its breakdown by the minute, over a 60-minute period.
- Next, see Database server analysis.
- nmmp

2018-03-28 01:09
on line slots for cash usa online gambling usa best online casino for real money mastercard casino online rival casino signup bonus online casinos accepting usa credit cards usa casino payment methodsonline casino bonus promo codes play casino slots no download rtg casinos ewallet express