Follow this section to debug the cluster.
Debug
This tab provides several debug options.
- On the ScaleArc dashboard, locate the Status column and click Cluster Settings.

- Click on the Debug tab.

Configure all the fields as follows: .

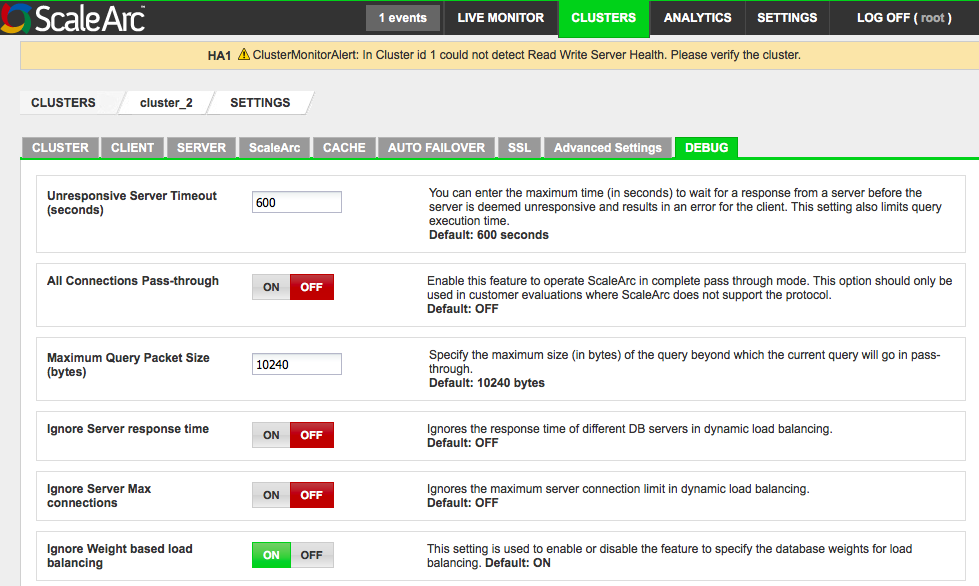
Field Description User input Unresponsive server timeout The maximum time (in seconds) to wait for a response from a server before the server is deemed unresponsive and results in a error for the client. This setting limits query execution time. It can also serve as a troubleshooting tool to determine if ScaleArc has caused an application issue.
Default value is 600 seconds. All Connections Pass-through For use in customer evaluations where ScaleArc does not support the protocol.
Turn ON to enable a complete passthrough. Maximum Query Packet Size (bytes) Specifies the maximum size of the query beyond which the query goes into passthrough mode. Default is 10240 bytes. Ignore Server response Time When enabled, ScaleArc ignores the response time of DB server from the dynamic load balancing calculations. Turn ON/OFF. Ignore Server Max Connections When enabled, ScaleArc ignores the max server connection limit settings of DB server from the dynamic load balancing calculations.
Turn ON/OFF. Ignore Weight based load balancing Used to enable/disable the feature which allows you to include user-specified database weights so as to bias dynamic load balancing's load calculations.
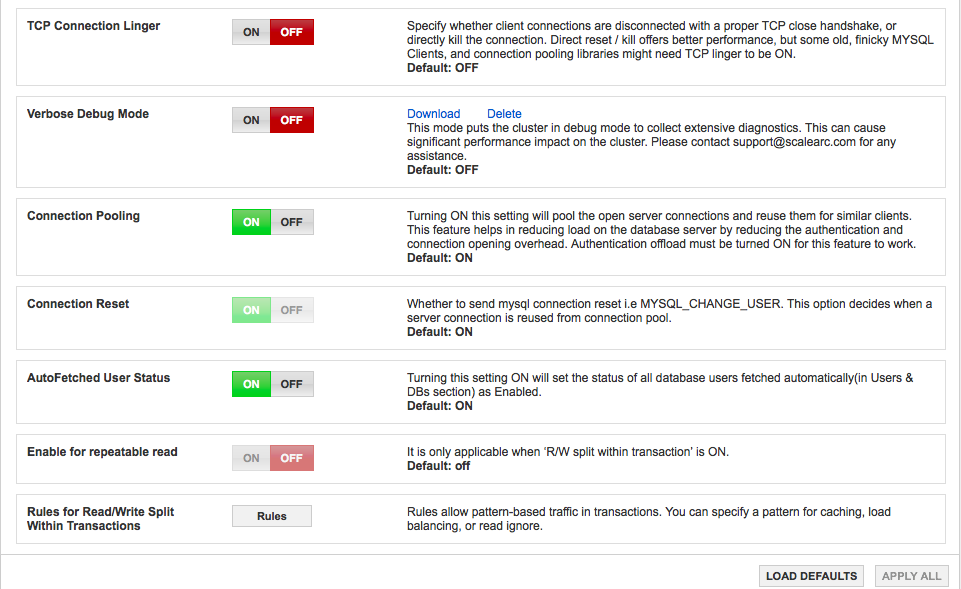
Turn ON/OFF. TCP Connection Linger Specifies whether client connections are disconnected with a proper TCP Close Handshake or directly kills the connection. Direct reset /kill offers better performance, but some old, finicky undefined clients and connection pooling libraries might require TCP Linger set to ON. Turn ON/OFF. Verbose Debug Mode When enabled, initiates the troubleshooting mode in ScaleArc at the cluster level. This mode captures and downloads the raw logs (including tcpdump) for the cluster.
Turn ON/OFF
Default is OFF.
Download/Delete Downloads the log files. Specify the duration that you wish to execute the verbose debug mode on a cluster. The verbose debug mode will generate an event for the log files. The downloaded log files are available in tar.gz format. Only the latest debug file is available for download. For example, use this feature to collect logs after running the Value Meter.
Example:
1 Turn ON Verbose Debug Mode. 2 Ensure ScaleArc is running traffic for a desired time period. 3 Turn OFF Verbose Debug Mode. 4 Download the tar file for analysis. Connection Pooling Requires configuration of the the SQL Server packet size, which is the same size as that of the TDS packets. You may need to reconfigure this setting to a higher value if the traffic throughput through ScaleArc is reduced, especially in authentication offload ON mode.
Turn ON/OFF. AutoFetched User Status When enabled, sets the status of all database users fetched automatically in the Users & DB’s section to Enabled. Default setting is ON. Enable for repeatable reads. This is enabled only when Read/Write Split Within Transactions is ON. Rules for Read/Write Split Within Transactions Rules allow pattern-based traffic in transactions. You can specify a pattern for caching, load balancing, or read ignore. They are enabled only when Read/Write Split Within Transactions is ON. See below. - Click Apply All to submit changes or click Load Defaults to reset to factory settings.
Configure traffic patterns
As part of advanced configuration, ScaleArc provides the option to configure patterns and rules at varying levels of granularity. These patterns and rules determine how ScaleArc caches queries and uses write ignore statements within transactions to load balance traffic. Refer to the KB article for details.

Comments