
Review ScaleArc Control Panel
The Clusters Control Panel within the ScaleArc dashboard is the workhorse for configuring and managing clusters. Take a moment to understand its different components.
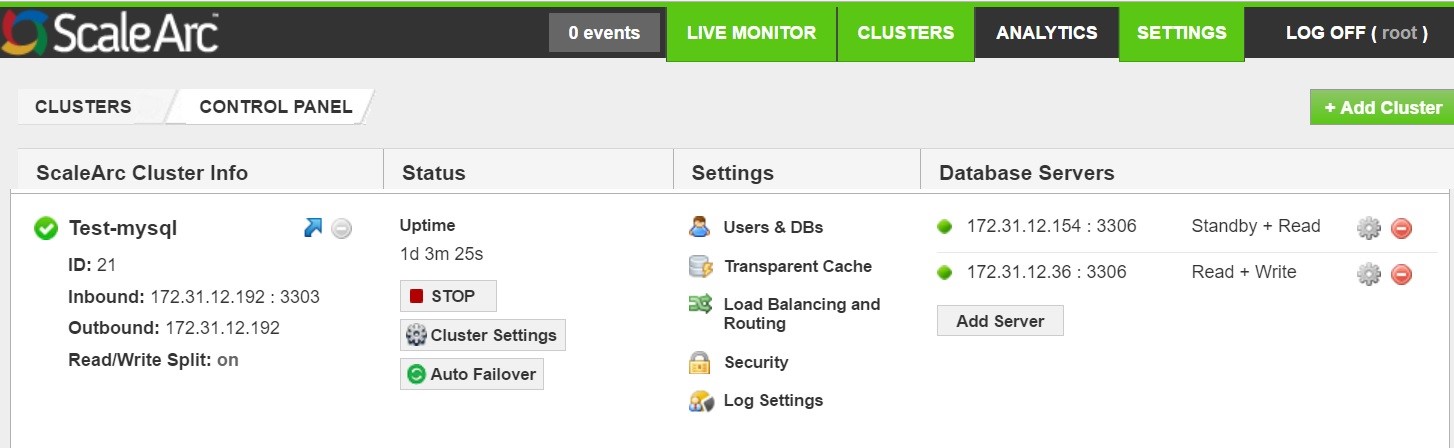
The ScaleArc dashboard displays the newly-created cluster in a panel. Any additional clusters you create will appear on the dashboard; one panel for each cluster.
Cluster panel
A cluster panel has four columns:
- The first column on the left represents application data (for example, cluster name, system-generated cluster ID, inbound and outbound IP addresses; the outbound in this column indicates the route from ScaleArc to the database server). This column is not editable.
- The central, two columns represent the ScaleArc components.
The last column on the right represents your database servers in the cluster.
Refer to Scale Cluster Info, Status, Settings, and Database servers for details on the elements displayed in each column.
- Click on the Clusters tab in the ScaleArc dashboard.
- Review the contents of the Control Panel. If you have created one or more clusters in ScaleArc, they appear on screen.
- Click on the Add Cluster button to create a new cluster.
- Click on any of the buttons or icons to open the corresponding screen.
- Click on the red button to delete a resource.
- Click on the Gear icon to access editing functions.
- Click the blue arrow in the first column of a cluster for quick links to hourly analytics, cluster status, and logs.
- You can edit a cluster's attributes or delete a cluster at any time.
- Next, go to Configure a cluster in this document to define the cluster settings.
On this page
Comments