
Applications communicate with the database server by exchanging queries and responses. ScaleArc's Traffic Analyzer is a solution to help you analyze the SQL traffic captured on the wire between your application and database server. It gives you a profile of the traffic pattern, which can then be used to fine tune the features of the ScaleArc Database Traffic Manager to get optimum throughput. This tool helps database administrators fine tune ScaleArc for optimum performance.
The Traffic Analyzer feature is divided into two functions:
- Traffic capture
- Traffic analysis
Traffic Capture
Use the traffic capture utility for capturing network level SQL traffic passing through the ScaleArc instance for analysis.
- On the ScaleArc dashboard click on Live Monitor > Diagnostics > Traffic Analyzer.

- Click Traffic Capture to select the parameters for capturing network traffic.
- Configure general options for capturing traffic. Select either cluster or provide host IP and port.

Configure parameters as follows:
Field
Description
Default/user input
Mode Mode to capture traffic. Select either cluster or host name and port range. Choose cluster or host and port. Cluster The cluster name. Select a cluster. Host The hostname. Enter the hostname. TCP port The TCP port. Enter the TCP port number for which you want to capture the data. Analyze after capture Enable/ disable traffic analysis of the traffic data. Use the slider to ENABLE/ DISABLE traffic analysis on captured data traffic. Start Begin capturing the traffic data. Click on Capture Scheduling Options to select the preferred scheduling method, duration or number of files.

If you select Capture Duration then configure the following parameters:
Field
Description
Capture Duration (sec) Define the maximum duration of the traffic capture to record data in seconds (1-86,400). The creation of the tcpdump file is stopped automatically once the maximum duration has been reached even if the size of file specified has not been reached. Size of File (MB) Define the maximum size (MB) of the tcpdump file captured. Each file that is captured is limited to specified size here. If you select Number of Files then configure the following parameters:

Field
Description
Number of Files Enter the number of files to be captured (1-100). The creation of the tcpdump file is stopped automatically once the maximum number of files has been reached. Size of File (MB) Define the maximum size (MB) of the tcpdump file captured. The creation of the tcpdump file is stopped automatically once the maximum file size has been reached. Click on Capture Advanced Options to configure additional parameters.

Field
Description
Start delay (sec) Enter the duration in seconds (1-3600) before the traffic capturing utility begins recording data. Advanced traffic capture options Enter advanced options for the traffic utility to record data. Refer to the tcpdump user commands page for information on configuring advanced traffic capture options. SQL ports for analysis (1-65535) Enter additional comma separated ports for analysis. Traffic Analysis
Use the traffic analysis option to analyze and generate reports for captured data,

Configure parameters as follows:
Field
Description
Select PCAP file Upload PCAP (.pcap, .cap, etc) file for analysis. SQL Ports for Analysis Enter additional comma separated ports (1-65535) for analysis. Analyzing Records
Once the file is analyzed a record is created.

Field
Description
Default/user input
System Storage The system storage used and available. Refresh Refreshes the list of records. Click to refresh the record list. Delete ALL Deletes all the reports generated. Click to delete all the reports. ID The number associated with a report. Date The date and time the report was created. Status The status of the record. Size The size of the record. Mode Displays the mode used to capture the traffic, either cluster name or host IP and port number. Action Icons provide options to analyze, download, delete, and view the report. Click on an icon to perform the related action. View a Report
Click on the eye icon to view a report. Select a file to view from the drop down list.
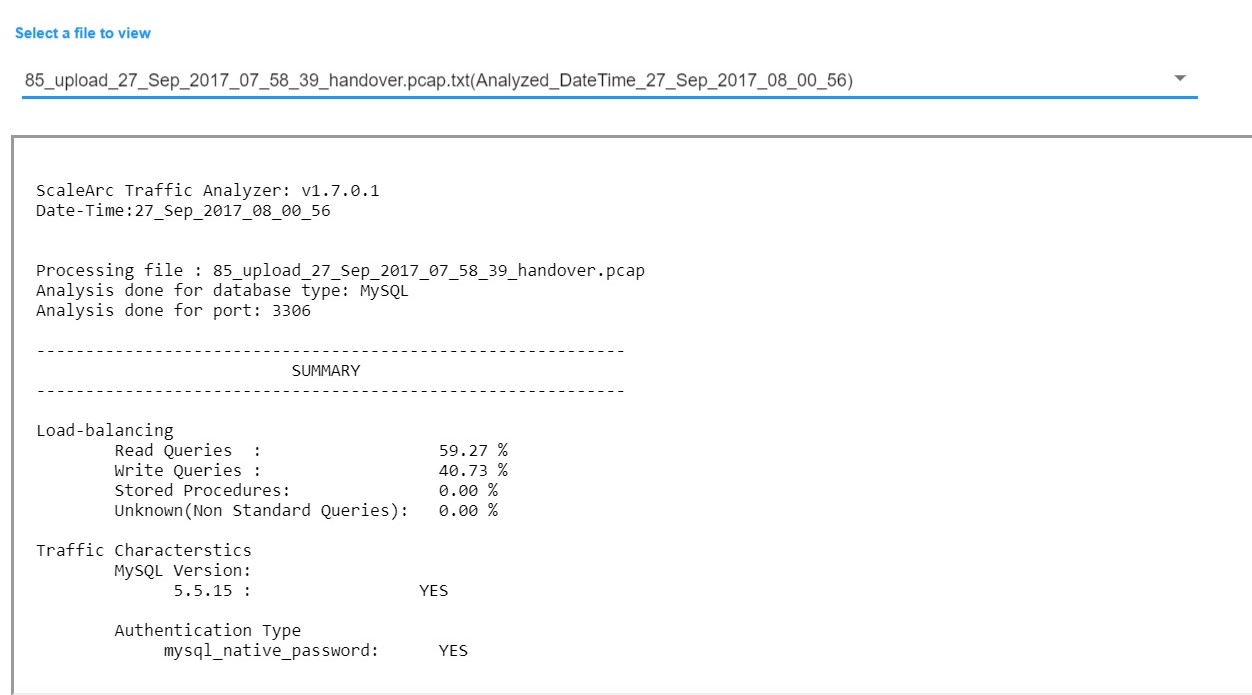
Click on the Traffic Analyzer Report page for more information on the report generated by the traffic analyzer tool.
Comments