
Cluster analysis gives us a breakdown of the query traffic associated with the selected cluster by the hour and minute, within the timeframe selected. You can download a report at any time from the page using the Download Report button for this time period.
Charts
ScaleArc represents the query traffic breakdown with the help of two chart types:
| Chart type | Description |
|---|---|
| Total queries pie chart |
Provides the percentage of total query use for each database within the cluster. |
| Server time pie chart. |
Provides the percentage of total server time each of the databases requires for its respective queries. Each database shows a breakdown of Total Queries, Cache Hit, Server Time, Cache Time, Time Saved, and Read:Write ratio. Highlighting a database exposes additional details for query breakdown by server within the ScaleArc cluster and types of queries |
Break down cluster traffic
Follow these procedures to reveal the traffic details, which include the total number of cache , server time, time saved, and Read-Write calls for the cluster in a selected time period (a day).
- Click on the Analytics tab on the ScaleArc dashboard.
- Select the time period.
Scroll down to the grid on the lower half of the screen.
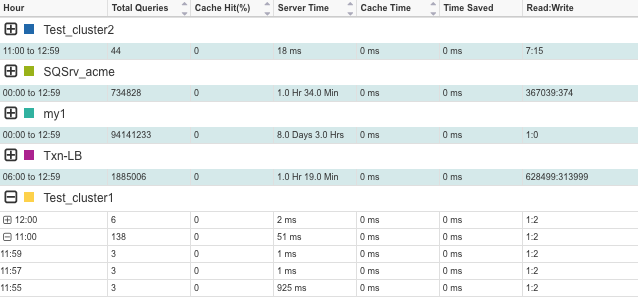
- Click on the + (plus) sign next to the cluster to see the hourly breakdown of traffic for a twenty-four period (if you selected a day for your time period).
- Select one of the hours and click on the + (plus) sign next to it to see its breakdown by the minute, over a 60-minute period.
- Next, see Database server analysis.
Comments