
ScaleArc's analytics provides a real-time picture of the flow of database traffic in your cluster(s).
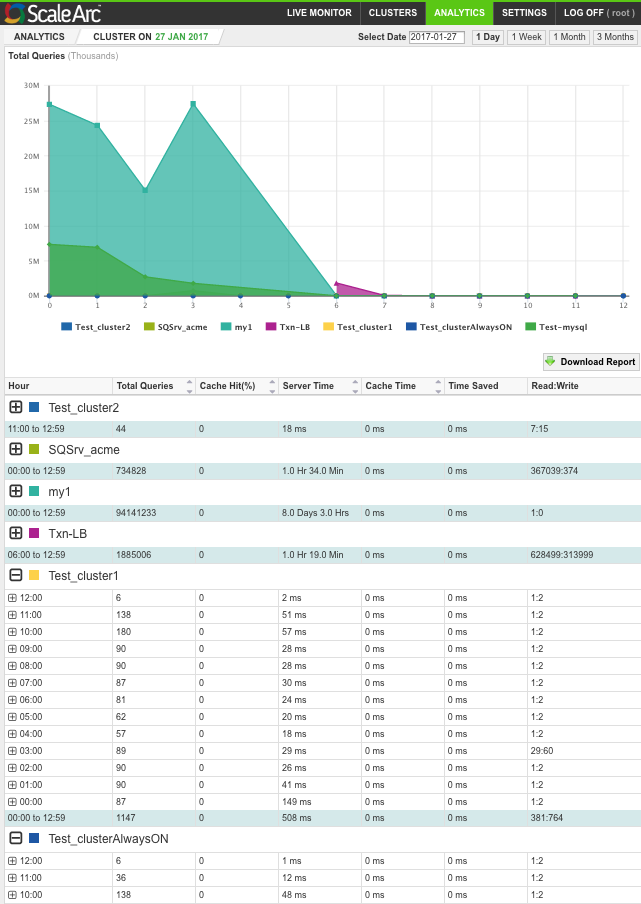
The top half of the Analytics screen displays a graph showing the total number of queries passing through ScaleArc at any given date, time (day, week, month, three months), and in any given cluster. Note that you can click Download Report at any time to get the details.
- Click on the Analytics tab on the ScaleArc dashboard.The graph shows the traffic for all the clusters in ScaleArc.
- Click on one or more clusters below the graph to display the query traffic for a selected cluster(s). Note that if you have several clusters, you can use the toggle button to deselect those clusters you don't want displayed on the screen. ScaleArc assigns random colors to isolate one cluster from another.
Click on a date from the date calendar to see the query traffic for the selected cluster(s) on that date. Or, select the time range to see the traffic for your selected cluster(s) by the day, week, month, or over three months. Alternatively, click and drag a section to determine the time range.
View total traffic per cluster
The grid on the lower half of the screen provides tabular data on the total cluster traffic, broken down by total traffic per cluster. Cache Hit (%) displays the percentage of the total queries returned from ScaleArc cache. The server time is the total time taken for the server to complete the transactions that were not returned from ScaleArc cache. Timed Saved is the amount of time saved by returning the query response from ScaleArc cache instead of sending to the database server for processing.
- Use the grid to read the volume of total query traffic for each cluster over a 24-hour cycle (if you selected a day in the calendar). Collapse or expand each cluster details as necessary.
- This section also breaks down the total queries by the total number of cache, server, time saved, and the ratio of Read to Write transactions for each cluster within the selected timeframe.
- Next, see Cluster analysis to break down the traffic, per cluster.
Comments