
Query pattern is a SQL query, with its variables masked. This feature groups SQL queries by common patterns in order to report or identify problem statements.
Identify query performance pattern
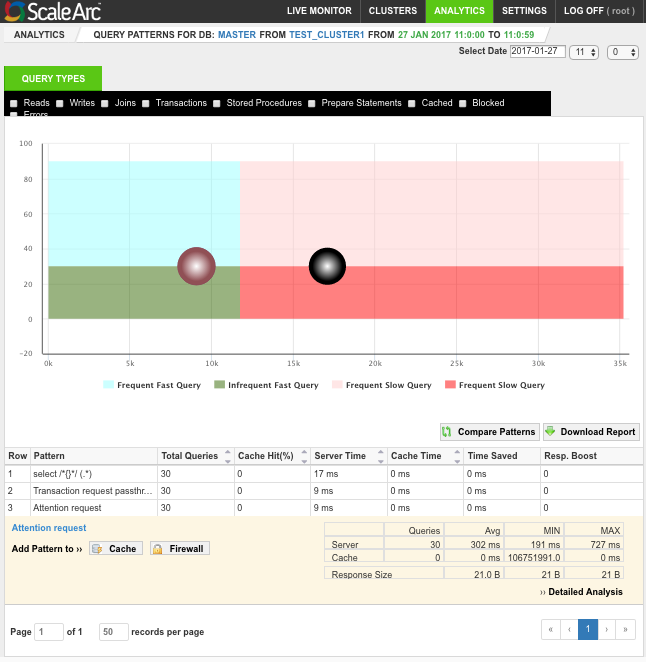
Query patterns fall into buckets, by performance type. Legends at the bottom of the graph help you identify each bucket and its performance type.
A four-quadrant graph displays these performance types:
- Queries that run frequently and are fast.
- Queries that run infrequently and are fast.
- Queries that are slow and infrequent.
- Queries that are slow and run frequently. These queries (if Reads) are typically the best candidates for adding to the cache.
This categorizations allows you to identify those queries you wish to tune, cache, or add to the firewall. Each query pattern is actionable; you can simply add to the cache or firewall without having to create rules for each query or needing to figure out the Regular Expressions necessary to match the pattern of your SQL statement. Click on the query structure in the tabular report that links to a unique query report for further analysis.
View SQL query pattern
When you select a bubble in the graph, it highlights the corresponding line in the report and provides a more detailed result of performance, both from the database and the ScaleArc cache.
You can further filter the results to specific types of statements, for example reads, writes, statements with joins etc. These filters appear as checkboxes at the top f the menu.
Follow these steps to view the query patterns:
- Click on the Analytics tab. Select the time period.
- Select the cluster and the hour.
- Hover over a database server to view its type and percentage of query traffic.
- Click on a database server to view this screen. The chart shows a four quadrant graph on top of the screen containing all the query patterns as bubbles, one bubble per query pattern. The four quadrants depict query query performance (Frequent Fast Query, Infrequent Fast Query, Frequent Slow Query, and Infrequent Slow Query). The grid at the bottom of the screen lists all the query patterns for the selected time segment.
- Select a section of the four quadrant to magnify the graph further. This may reveal hidden bubbles that you can verify against the list of query patterns in the lower section. Click on the bubble to highlight the row in the related row in the grid.
- Select one or more checkboxes on top of the screen, for example, Reads and/or Writes to narrow down the query types in the graph for your selected time period.
- Select one of the four checkboxes for query performance category to further narrow down the query pattern detail.
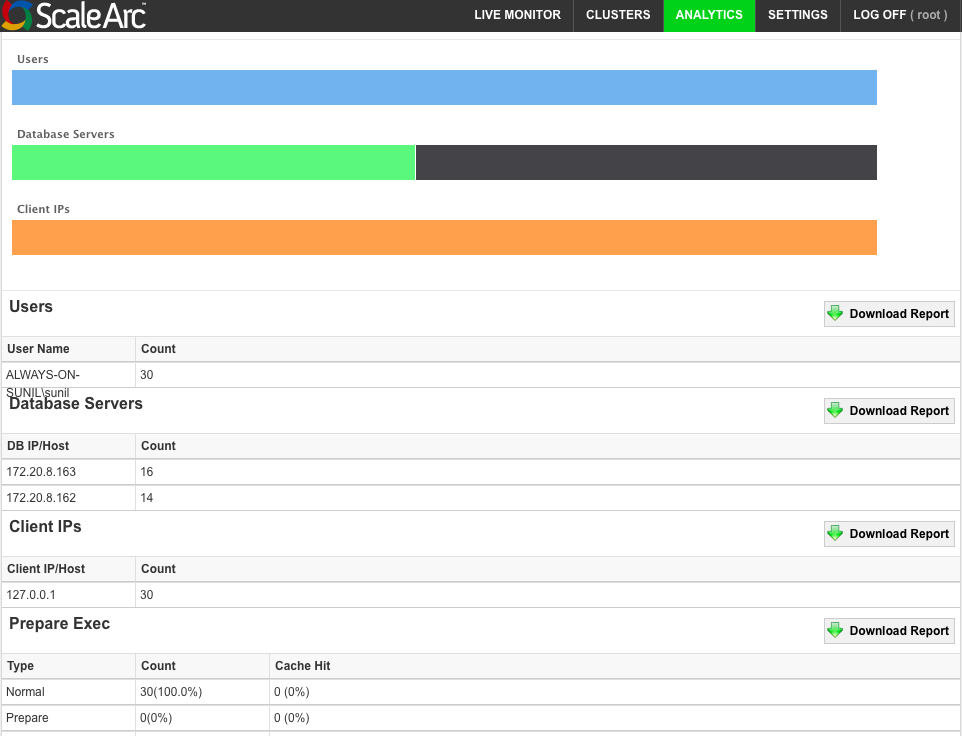
- Click Detailed Analysis for a report on the select query pattern by number of users, database servers, client IPs, Prepare Exec (Normal, Prepare, and Exec), and Performance stats (server and cache). For each section, you can download a report on your local machine.
View query pattern detail
The table in the grid below breaks down the total queries, cache hit, server time, cache time, time saved (by ScaleArc), and Read:Write ratio for each query pattern.
- Hover on each row of the grid to display related details for each query pattern.
- Click Cache to open the popup in the grid detail to add the query pattern as a cache rule.
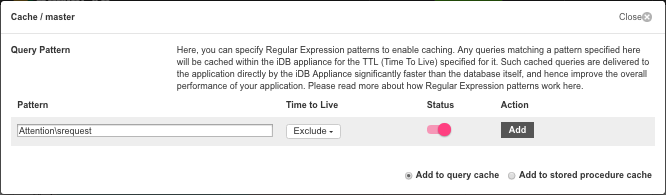
- The selected query pattern appears in the pattern field.
- Enter an appropriate value for TTL (Time-To-Live) from the drop down.
- Turn on cache rule.
- Select the appropriate radio button to save the query as a query cache or as a stored procedure cache.
- Click Add to save it.
- Alternatively, click Firewall on the Query Pattern detail in the grid to add it as a firewall rule.
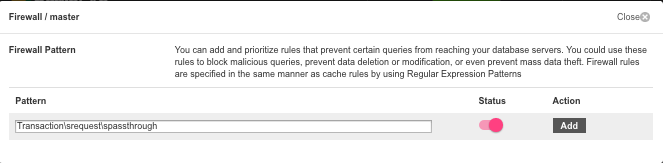
- The selected query pattern appears in the pattern field.
- Turn on firewall status.
- Click Add to save it.
- Click Detailed Analysis for a further breakdown.
- Next, see Unique query pattern analysis.
Comments