
Unique query analysis
SQL statement analysis is a detailed account for the selected SQL structure, per database. The SQL statement analysis gives us unique information relative to each query falling under the selected SQL statement structure. ScaleArc allows you to add the unique query to as a cache or a firewall cache rule.
View a unique query
Each query pattern contains one or more unique queries. To view the contents of a query pattern:
- Click on the Analytics tab. Select the time period.
- Select the cluster and the hour.
- Hover over a database server.
- View the query pattern grid.
- Click on a query pattern to open the screen for unique queries.

- The graph saws the total unique queries for the specified period and the time to process them on the server(s). Select a different time period at any time in this process to see the unique queries in that period. Note that the new time period may not have any queries. The queries may be broken down pages, if the list too long.
You can add the unique query as a cache or firewall rule. You need to add each query, one at a time.
- Click Cache to open the popup in the grid detail to add the query as a cache rule.

- The selected query appears in the query field.
- Enter an appropriate value for TTL (Time-To-Live) from the drop down.
- Turn on cache rule.
- Select the appropriate radio button to save the query as a query cache or as a stored procedure cache.
- Click Add to save it.
- Alternatively, click Firewall on the Query detail in the grid to add it as a firewall rule.
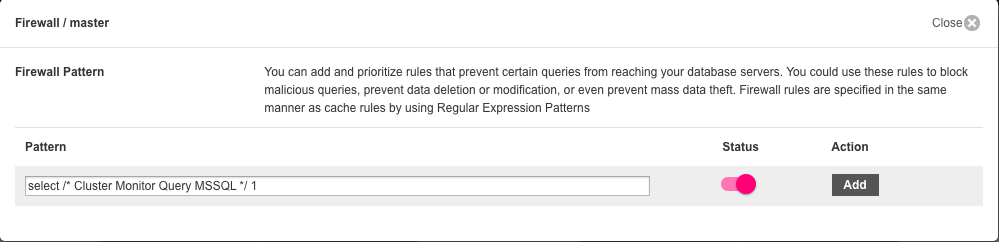
- The selected query appears in the query field.
- Turn on firewall status.
- Click Add to save it.
On this page
Comments